
Published: Nov 29, 2021 Source article by: mbshighway
News regarding new home sales, home appreciation and inflation all made headlines. But what does the data really mean?
Sales of new homes surged in September, rising 14% from August at an 800,000 annualized pace. This was stronger than expectations and the highest reading since March. However, on an annual basis, sales were 18% lower when compared to September of last year – but there is more to this story as noted below. Meanwhile, Pending Home Sales, which measure signed contracts on existing homes, fell 2.3% in September after an 8% gain in August.
The ongoing high level of demand for homes around the country continues to help prices appreciate. The Case-Shiller Home Price Index showed that home prices rose 1.2% in August and 20% year over year. The Federal Housing Finance Agency (FHFA), which measures home price appreciation on single-family homes with conforming loan amounts, also reported that home prices rose 1% in August and 18.5% when compared to August of last year. While these are certainly still strong levels of appreciation, there are signs that appreciation may be moderating. Don’t miss the explanation below.
The latest Personal Consumption Expenditures (PCE) report showed that consumer inflation was up 0.3% in September. Year over year the index rose from 4.2% to 4.4%, which is the hottest reading in 30 years. Core PCE, which strips out volatile food and energy prices and is the Fed’s real focus, was up 0.2% in September while the year over year reading remained at 3.6%.
Rising inflation is always critical to monitor because it can have a big impact on Mortgage Bonds and home loan rates, which are tied to them. While the annual Core PCE figures may appear to suggest that consumer inflation is holding steady, it’s important to look further into the data. Read on for additional analysis about this.
The unemployment picture continues to improve, as the number of people filing for benefits for the first time and on a continuing basis both declined to their lowest levels since before the pandemic began. Extended Benefits and the federal COVID plans all showed declines in the latest week as well. There are now 2.8 million people in total receiving benefits, which is down by almost 450,000 from the previous week.
Lastly, the first look at Gross Domestic Product (GDP) for the third quarter showed annualized growth of 2%, which was below the estimate of 2.6% but better than the 0.5% estimate from the Atlanta Fed. Real final sales fell 0.1%, which means that most of the gain came from inventory build and this added 2% to GDP. Personal spending was up 1.6%, driven by spending on services, as goods spending fell. Remember that GDP was 6.7% annualized in the second quarter so this third quarter reading reflects a big revision lower on full year GDP.
September New Home Sales Beat Expectations
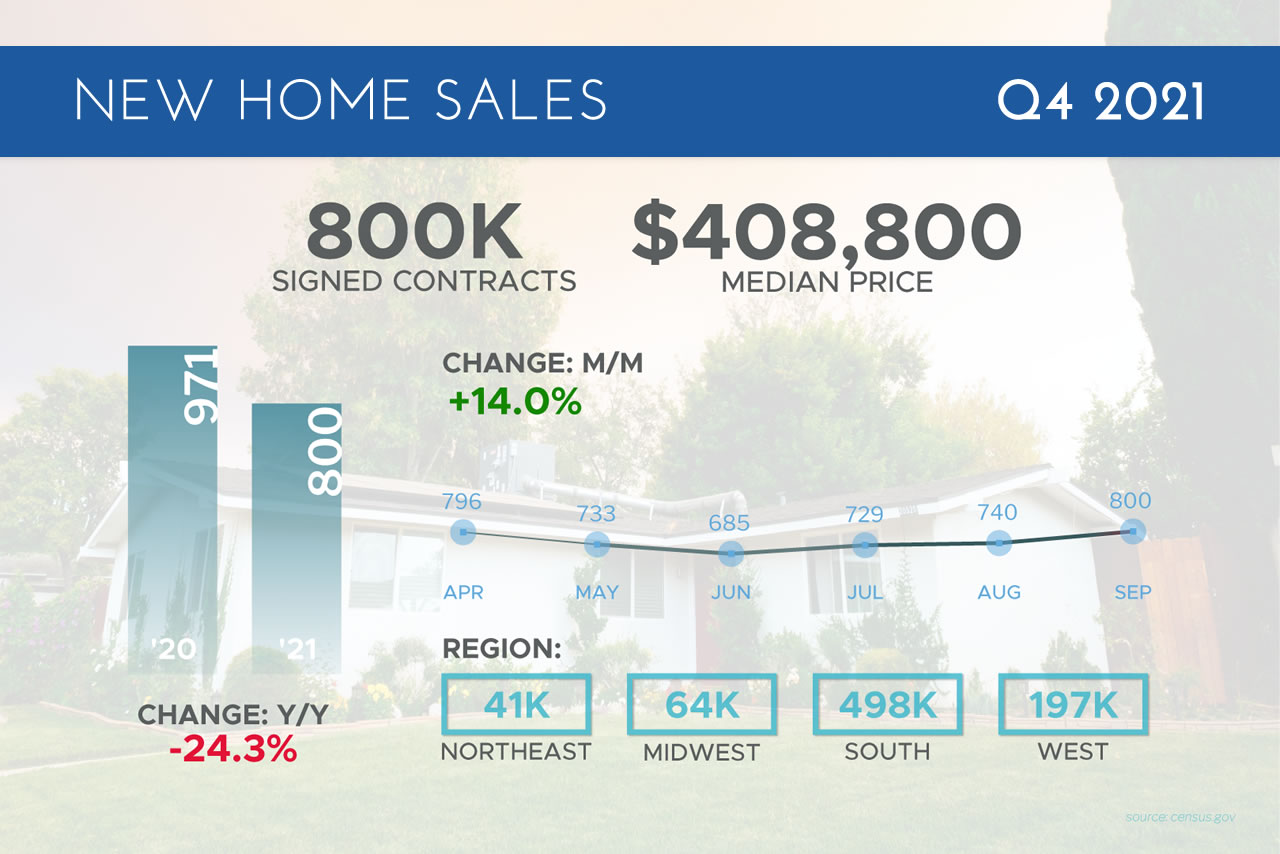
On an annual basis, sales were 18% lower when compared to September of last year, but that does not tell the whole story due to the market conditions from the pandemic last year. Sales were actually 14% higher when compared to September 2019, which is considered a more normal market.
Looking at inventory levels, there were 379,000 homes for sale, which was unchanged from August’s report but up 32% from last year. However, there’s an important caveat to this data. Of the homes for sale, only 9% were actually completed, while the rest are either not started or under construction. This speaks to the backlog builders are experiencing and the continued tight supply of homes actually being delivered.
The median home price was reported at $409,000, which is 18.7% higher year over year. Note that the median home price is not the same as appreciation. It simply means half the homes sold were above that price and half were below it.
Also of note, Pending Home Sales, which measure signed contracts on existing homes, fell 2.3% in September after an 8% gain in August. Sales were also down 8% year over year, though this is not a bad annual reading considering the lack of inventory and tough comparisons to the market from last year.
Home Price Appreciation Slows But Remains Strong

While home price appreciation is expected to continue, this data could suggest that the pace of appreciation may begin to slow. Note that this does not mean that home prices will drop. It simply means that they may rise at a more modest pace.
The 20-city index also rose 1% in August and 20% year over year, with all the cities showing strong gains. Phoenix (+33%), San Diego (+26%), and Tampa (+26%) reported the highest annual gains.
The Federal Housing Finance Agency (FHFA) released their House Price Index, which measures home price appreciation on single-family homes with conforming loan amounts. While you can have a million-dollar home with a conforming loan amount, the report most likely represents lower-priced homes, where supply has been tight and demand strong.
Home prices rose 1% in August and they were also up 18.5% year over year, which is down from 19.2%. This is the first time we saw prices moderate on an annual basis in quite some time. Again, we are still seeing home prices rise, but at a slightly slower pace.
The Real Story Regarding Inflation
Core PCE, which strips out volatile food and energy prices and is the Fed’s real focus, was up 0.2% in September. The year over year reading remained at 3.6%.
Remember that the year over year figures are calculated on a 12-month rolling basis. This means that in last Friday’s report, the September 2020 reading of 0.14% for Core PCE was replaced with the September 2021 reading of 0.2%. This is why the year over year numbers remained the same with rounding.
When we look ahead to the next two reports, here are the figures we will be replacing. First, 0.0% monthly Core PCE for October 2020 will be replaced with the data for October 2021 when it is reported on November 24. Then, 0.0% monthly Core PCE for November 2020 will be replaced with the data for November 2021 when it is reported on December 23.
This means if we continue to see monthly readings of 0.2%, we would see the year over year Core PCE reading climb by 0.4% to somewhere around 4%.
Why is this important?
Rising inflation can cause home loan rates to move higher. Home loan rates are tied to a type of Bond called Mortgage Backed Securities and as inflation erodes a Bond’s fixed return, the only way to compensate investors is with a higher rate. So, the possibility of rising inflation is always something we need to monitor.
It’s also worth noting that PCE is a poor measure of inflation because it has a low weighting towards housing and out of pocket medical expenses, both of which are very important to consumers. Real inflation is likely higher than what is reflected in this latest report.
On a related note, Imitation Homes, which is the largest landlord in the US, reported that new rents are up 18% year to date, while renewals are up 8%. Again, the PCE and Consumer Price Index inflation reports do a poor job of capturing this, showing rents only up 2% on a year over year basis.
In addition, incomes were down 1% overall due to the expiration of the extra benefits and Covid unemployment plans. But private sector wages were up almost 1% last month and running at a 10% increase if you annualized this figure over the last six months. This speaks to the wage-pressured inflation we are seeing from most companies having to pay more to retain and hire people.
Jobless Claims Continue to Improve

Initial Jobless Claims declined once again in the latest week, as the number of people filing for unemployment benefits for the first time fell 10,000 to 281,000. This is the lowest reading since before the pandemic.
Continuing Claims, which measure people continuing to receive benefits, also reached a pandemic-era low as they declined by 237,000 to 2.2 million.
The federal COVID plans, including the Pandemic Unemployment Assistance and Emergency Claims, fell by 335,000 as those plans continue to expire. Extended Benefits also dropped by 17,000.
There are now 2.8 million people in total receiving benefits, which is down by almost 450,000 from the previous week. The jobless claims picture continues to make significant improvements, despite the fact that many job openings remain.
Technical Picture
Mortgage Bonds recovered nicely after being rejected by the ceiling at the 25-day Moving Average and ended last week near that level. The 10-year has retreated from the important 1.60% level and ended the week testing a floor at the 25-day Moving Average.
Phone: 888.718.4440

Leading Mortgage Lenders
in South Florida
Premier Financial Group
With over 25 years of combined experience in the lending industry, our team of mortgage and refinance professionals work hard to make closing fast and simple.
Phone: 305-282-5527
Licensed to work in Florida: (LO24789)
Mortgage Lenders Florida
